
 [TR]
[TR]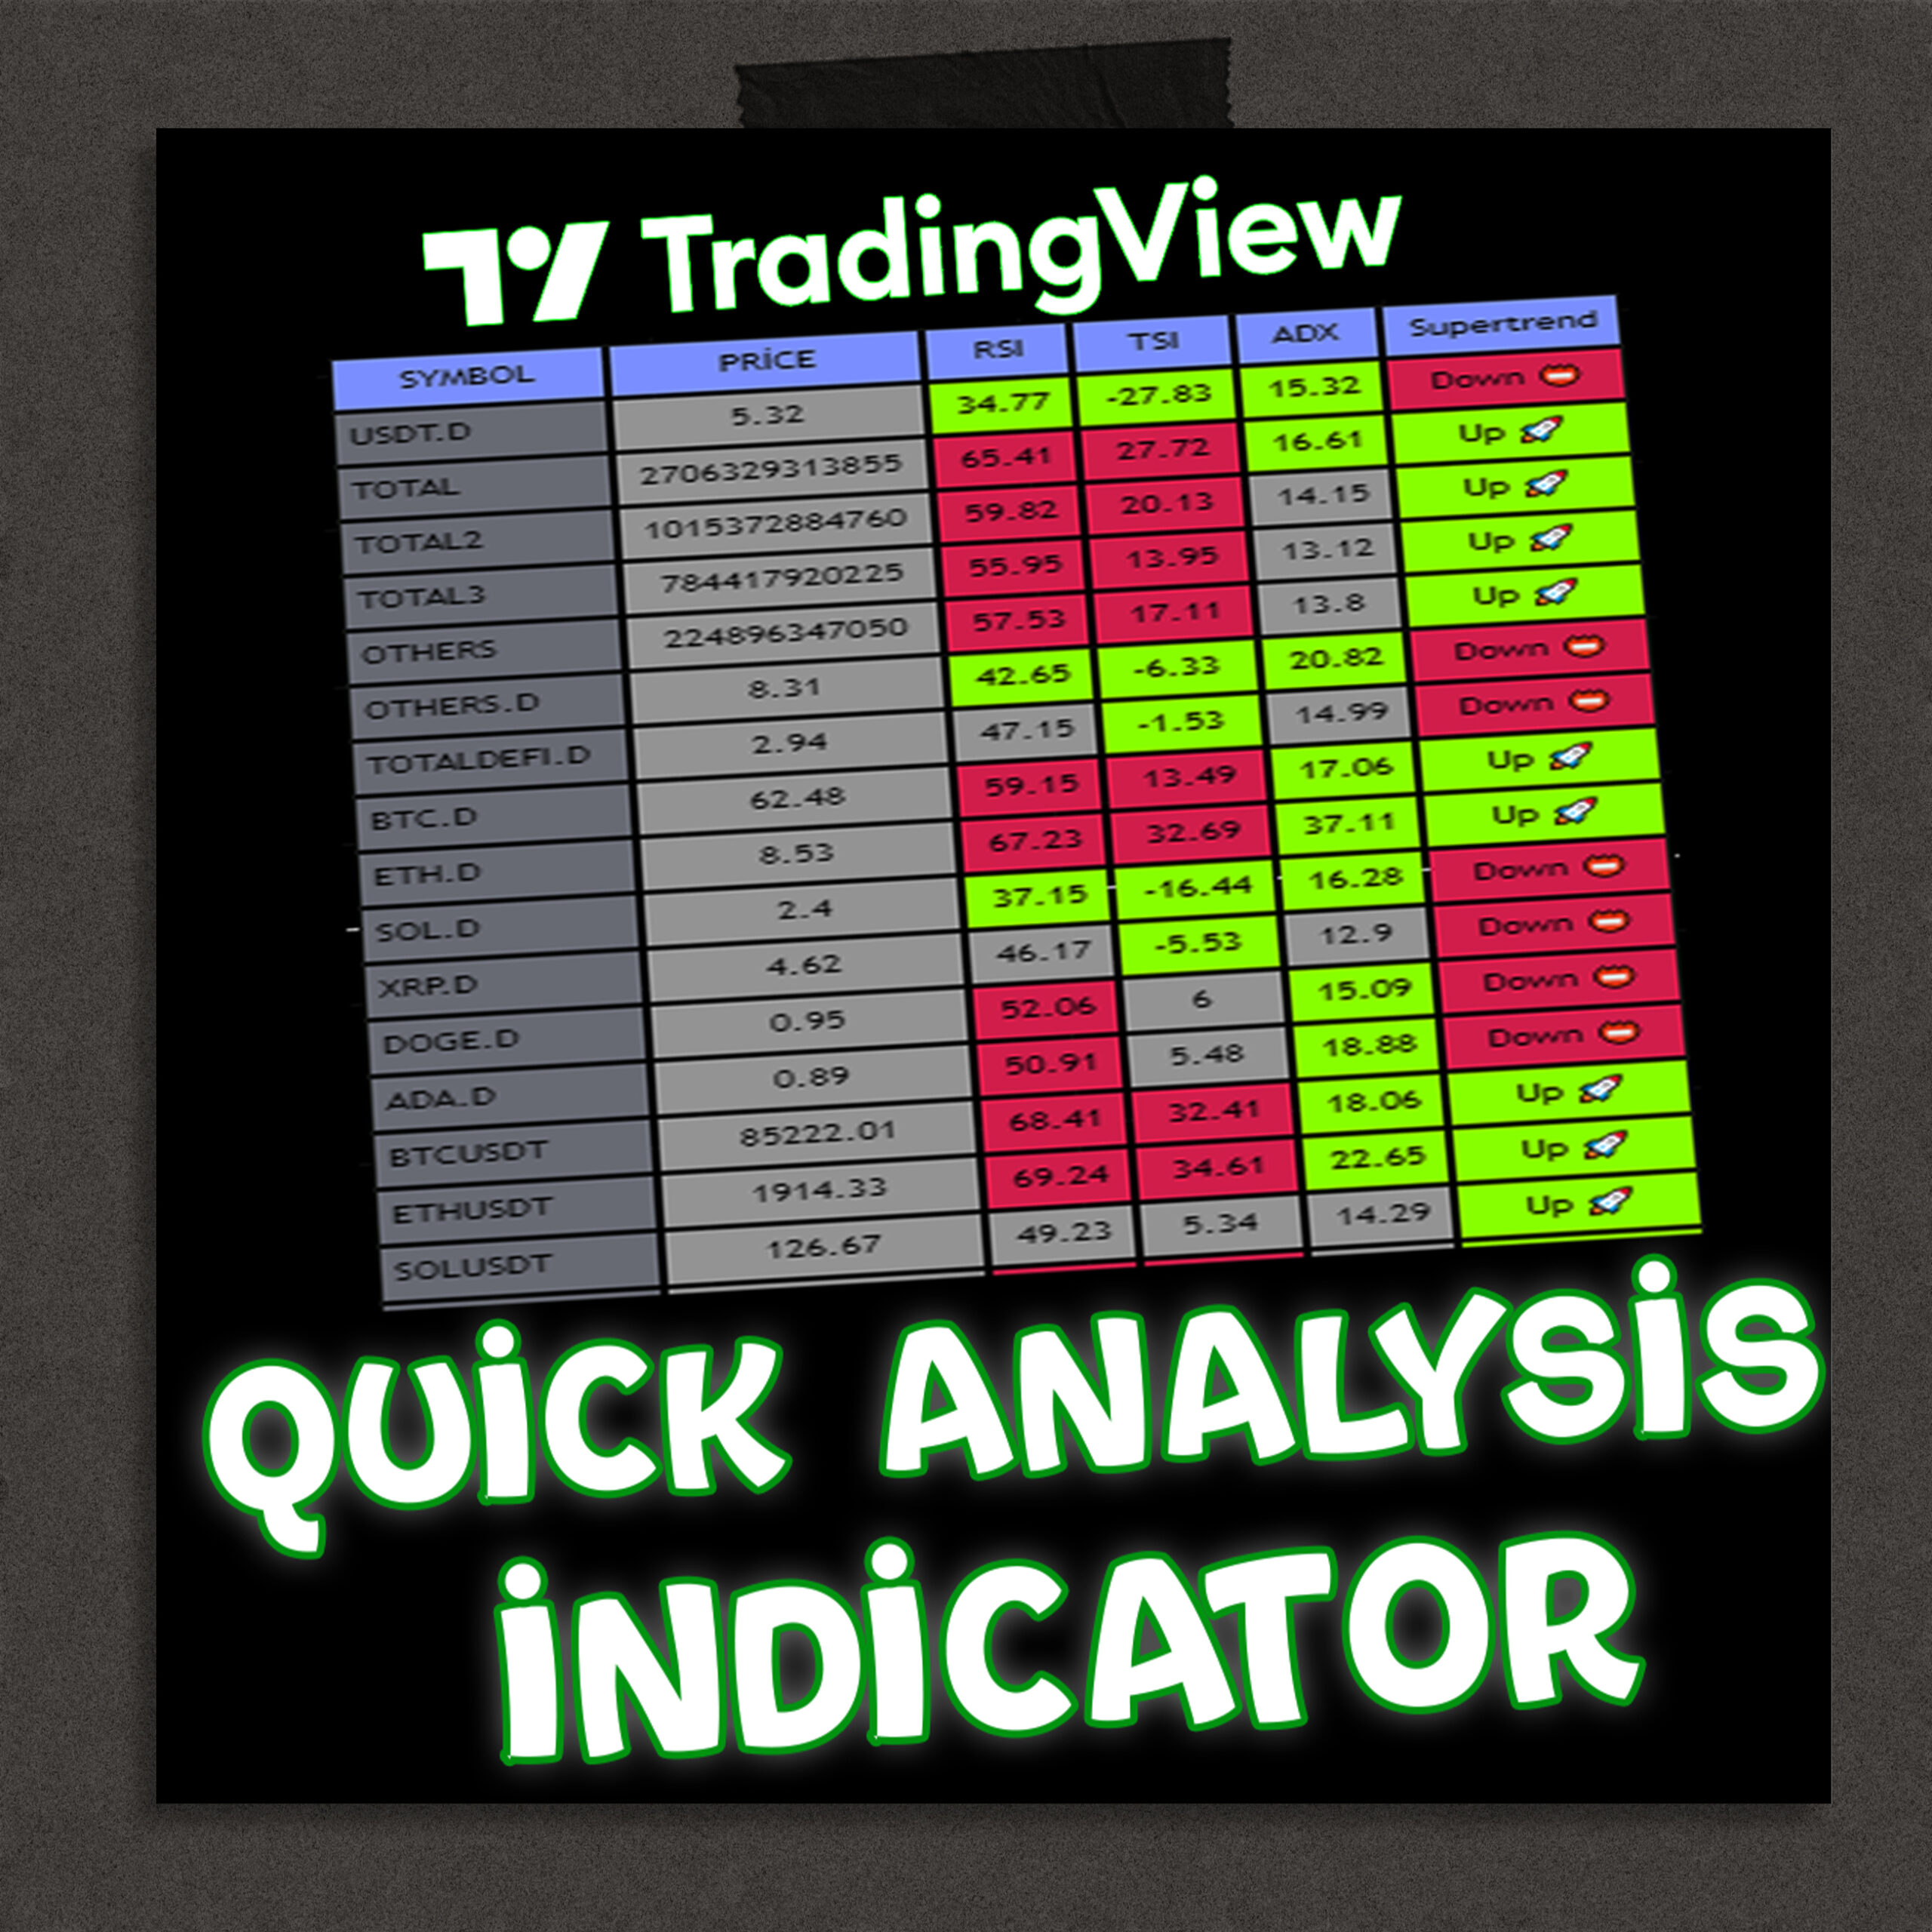
Quick Analysis Indicator
1. Introduction: Purpose of the Indicator
Quick Analysis is a multi-symbol supported technical screener that can analyze several assets simultaneously. It collects values of key technical indicators such as RSI, TSI, ADX, and Supertrend for up to 30 different assets and displays them in a customizable dashboard table overlaid on the chart. This setup allows traders to easily and quickly compare market conditions across different symbols.
2. How the Algorithm Works
a. Input Settings
- The indicator’s title, short name, and chart overlay option are defined.
- Users can adjust the dashboard’s position (e.g., bottom right), size, and visibility.
- Customizable parameters are provided for RSI, TSI, ADX, and Supertrend.
- Up to 30 symbols can be analyzed; each one can be enabled or disabled by the user.
b. Technical Indicator Calculations
- RSI: Calculated based on the closing price.
- TSI: Calculated using price changes and double EMA smoothing.
- ADX: Measures trend strength by comparing directional movements.
- Supertrend: A trend signal based on the ATR (Average True Range).
d. Table Visualization
- The dashboard is displayed as a table, adjustable by position and scope.
- Headers: “SYMBOL”, “PRICE”, “RSI”, “TSI”, “ADX”, “Supertrend”
- Conditional formatting: RSI and TSI cells change color based on thresholds.
- Supertrend status: Displayed as Up 🚀 or Down 📛.
3. Indicator Summary
- RSI (Relative Strength Index): Measures the speed and change of price movements. Values above 70 indicate overbought conditions, while values below 35 indicate oversold conditions.
- TSI (True Strength Index): Measures price momentum using double EMA smoothing. Useful for identifying trend strength and potential reversal points.
- ADX (Average Directional Index): Indicates the strength of a trend. Higher values suggest strong trends; lower values suggest weaker trends.
- Supertrend: A trend-following indicator based on ATR. It identifies market direction and potential support/resistance levels.
4. How It Works
- Data Gathering: Real-time data is fetched from multiple symbols using TradingView’s
securityfunction. - Calculations: RSI, TSI, ADX, and Supertrend are calculated per symbol using custom algorithms.
- Visualization: The table displays symbols, prices, and indicator values with colors and icons for quick insight.
5. Settings Panel
- Dashboard Settings: Toggle the panel on/off, choose its position and size.
- Indicators: Customizable parameters for RSI, TSI, ADX, and Supertrend.
- Symbol Management: Enable/disable each of the 30 symbols and enter their names individually.
6. Indicator Advantages
- 📌 Comprehensive Market Overview: Aggregates technical analysis data for multiple symbols in one panel.
- 📌 Flexibility: All indicator and table settings are fully customizable to suit user strategies.
- 📌 Time Efficiency: Eliminates the need for manually tracking multiple assets.
- 📌 Visual Clarity: Color-coded tables and icons provide instant decision-making support.
- 📌 Advanced Comparative Analysis: Enables the comparison of up to 30 symbols simultaneously.
7. Customization Options
Indicator periods, threshold values, and table appearance can be adjusted. With symbol selection, dynamic analysis across various markets is made possible.
8. Conclusion
The Quick Analysis indicator combines essential technical indicators like RSI, TSI, ADX, and Supertrend into a single view, offering traders powerful multi-asset insights at a glance. Its real-time updates, user-friendly interface, and high level of customization make it an indispensable tool for effective and comprehensive market analysis.


Reviews
There are no reviews yet.