
 [TR]
[TR]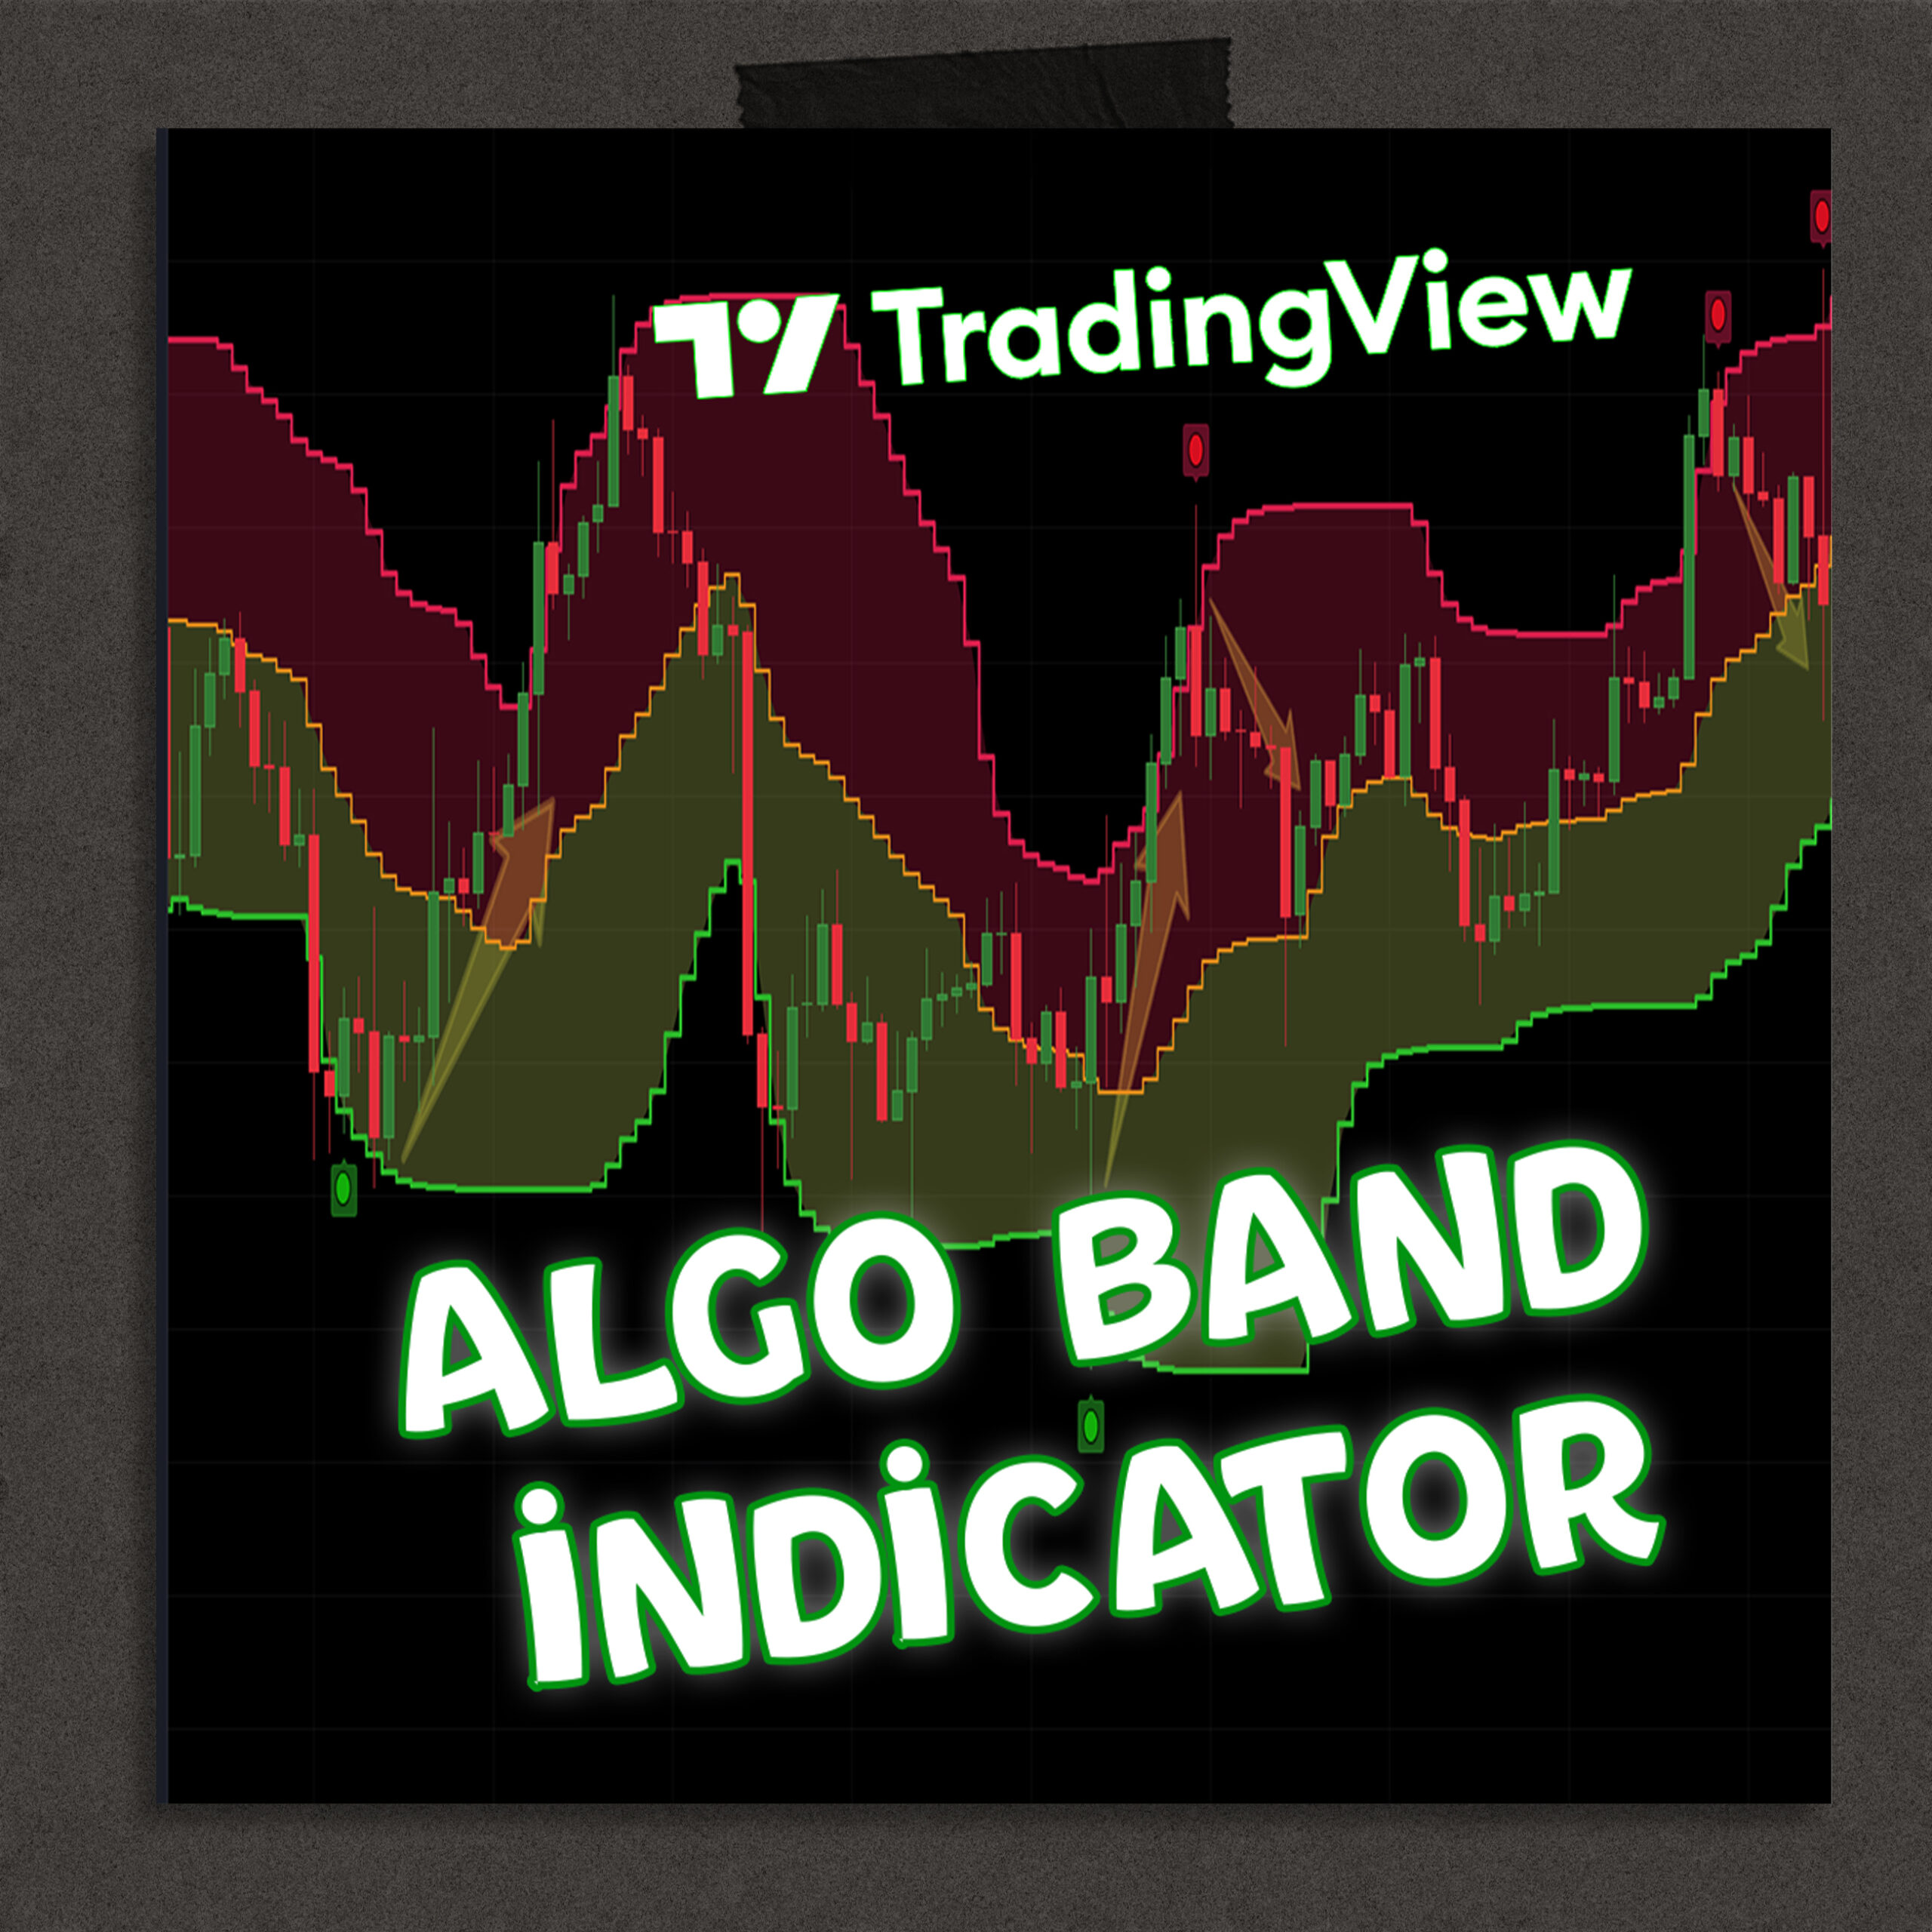


Algo Bands Indicator Description
Overview
The Algo Bands indicator calculates the highest, lowest, and average price levels over a specified period. Based on the interaction of the price with these levels, it generates buy and sell signals. The indicator visualizes these bands, signals, and colored backgrounds on the chart for trend analysis.
Features
- High Band: The average of the high prices within the specified period.
- Low Band: The average of the low prices.
- Average Band: The midpoint between the high and low bands.
Buy and Sell Conditions
Sell Condition
A sell signal is generated when one of the following conditions occurs:
- Crossunder: The closing price crosses below the high band, and the candle shows a bearish move.
- Reversal: The high price exceeds the high band, but the closing price fails to hold and remains below the band.
Buy Condition
A buy signal is generated when one of the following conditions occurs:
- Crossover: The closing price crosses above the low band, and the candle shows a bullish move.
- Reversal: The low price drops below the low band, but the closing price recovers and remains above the band.
Signal Visualization
Signals are displayed on the chart as follows:
- Sell Signal: Red Marker (🔴).
- Buy Signal: Green Marker (🟢).
Background colors also reflect market direction: Red for a bearish trend, and Green for a bullish trend.
Multi-Timeframe Analysis
The Algo Bands indicator performs trend analysis on 1-hour, 4-hour, and daily timeframes. This allows traders to identify support and resistance levels across different timeframes.
Benefits
- Trend Identification: Identifies support and resistance levels.
- Clear Signals: Provides precise buy and sell signals.
- Noise Reduction: Filters false signals using SMMA.
- Multi-Timeframe Analysis: Analyze trends across various timeframes.
- Real-Time Alerts: Quick notifications via Telegram integration.
- User-Friendly: Suitable for traders of all experience levels.
How It Works
- The high, low, and average bands are calculated.
- When the price interacts with these bands, buy or sell signals are generated.
- Signals and bands are visualized on the chart.
- Real-time alerts are sent via tools like Telegram.

Reviews
There are no reviews yet.