
 [TR]
[TR]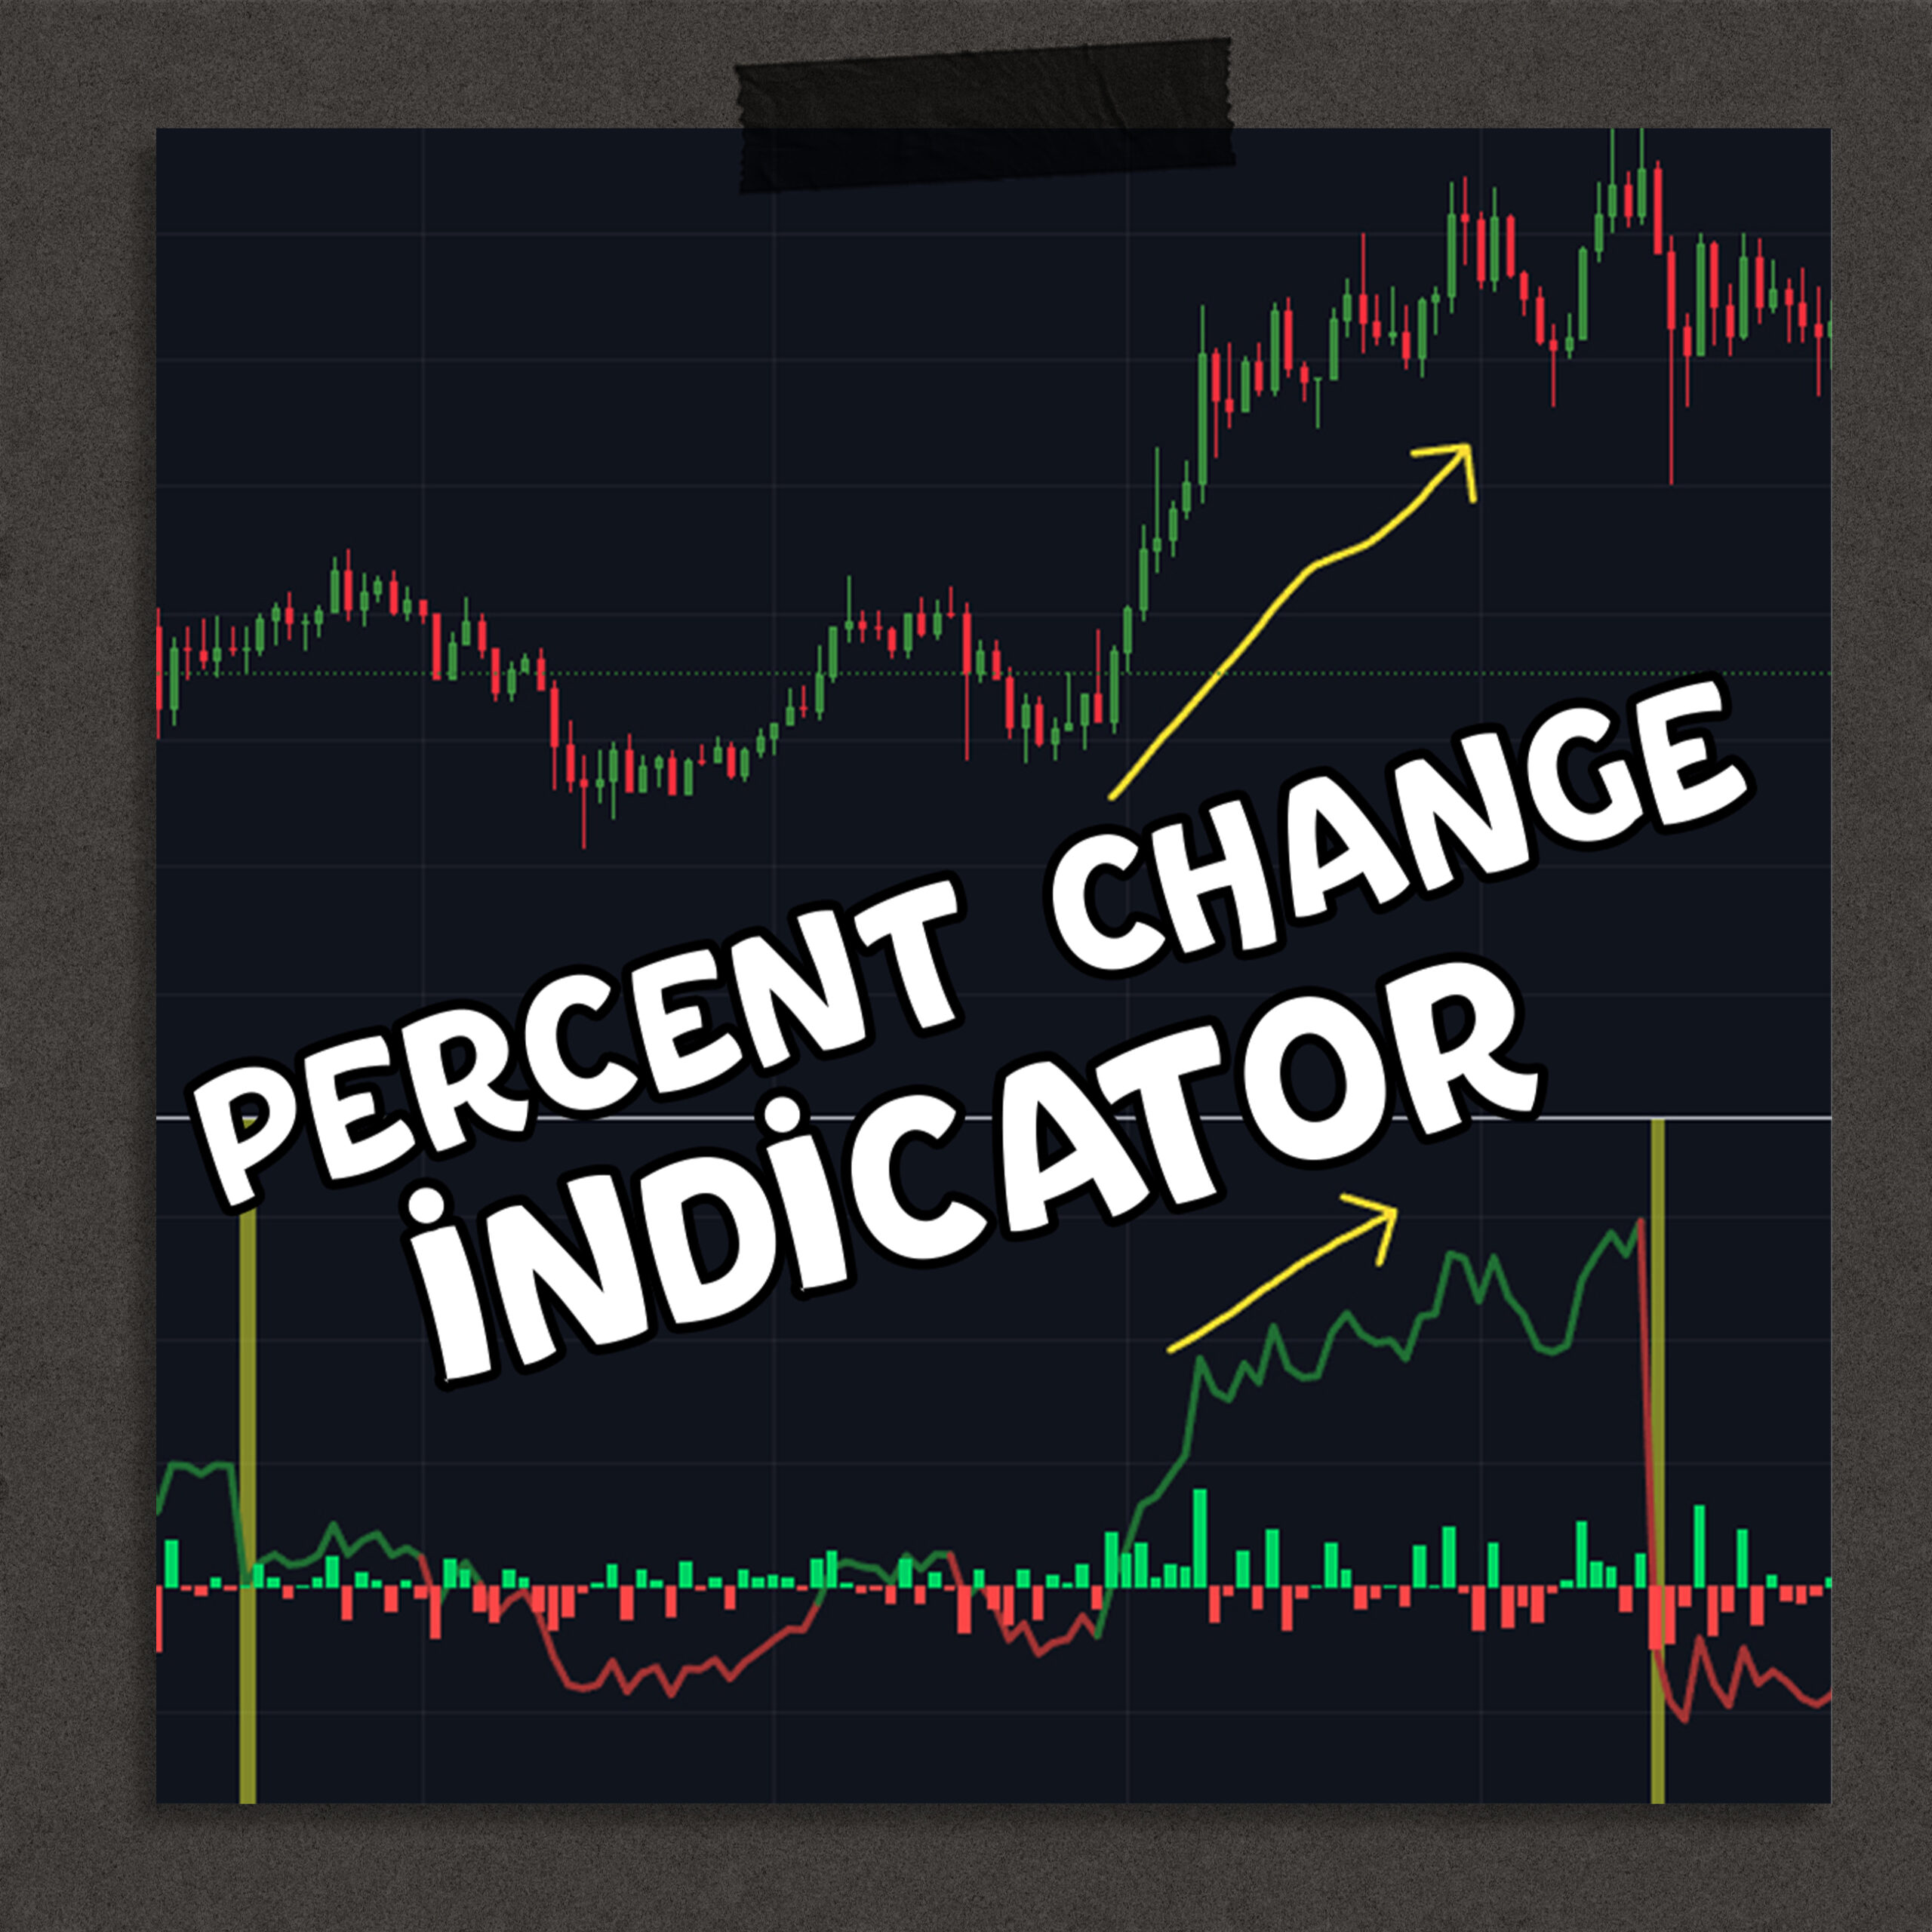
How It Works:
- Daily Percent Change Calculation: The script computes the percentage change of an asset’s price daily. It uses TradingView’s robust
ta.roc()function to calculate the rate of change between closing prices, ensuring accuracy. - Color-Coded Visualization: Changes above zero are displayed in green, signaling positive growth, while changes below zero are shown in red, indicating a drop.
- Background Highlighting: New trading days are distinctly marked with a highlighted yellow background, enhancing chart readability.
- Customizable Settings: Users can tailor the line and column colors for better alignment with their trading preferences.
- Compact & Efficient: With optimized plotting functions, this indicator delivers precise and responsive visual data.
Key Features:
- Ease of Use: Ready-to-use on TradingView with a few clicks.
- Customizable Visuals: Choose your preferred colors for positive and negative values.
- Enhanced Insights: Highlighted daily changes allow quick trend spotting.
- Scalable: Perfect for monitoring various timeframes, with a focus on daily changes.
İndicator Link


Reviews
There are no reviews yet.